Liquid Alternatives / Trends

Firma hinter Kryptowährung TerraUSD meldet Insolvenz an
Die Kryptowährung TerraUSD war schon vor zwei Jahren am Ende. Nun hat auch das Unternehmen Terraform Labs Insolvenz angemeldet, das hinter Cyberdevise stand.

Mehr Licht im Blockchain-Dschungel
Die Deka bietet einen ersten breiten Marktbericht über Wertpapiere, die über die Blochchain ausgegeben werden. Im neuen Digtal Asset Index dominieren Anleihen. Aber auch bei Kryptofonds und Namensaktien tut sich was.

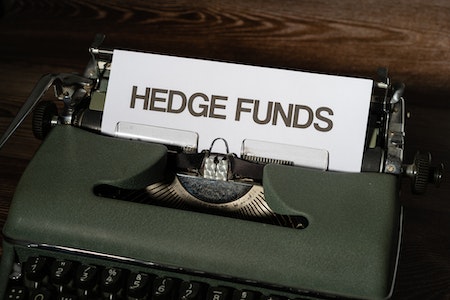
Hedge funds maintained strong December streak, data shows
Hedge funds sustained strong December performance with 2% weighted average return, according to data from the Citco group of companies (Citco).In December, hedge funds exhibited positive performance across all strategies, with event driven funds leading the way with the highest weighted average return at 3.5%. Equities and fixed income arbitrage followed closely with returns of […]
Global ETF flows reach €770bn in 2023
According to Amundi Asset Management’s ETF Flows Analysis for December 2023, global exchange-traded fund (ETF) flows reached a remarkable €770 billion over the year.The report highlighted a substantial surge in equity inflows in December, with investors adding €109.6 billion in response to the Federal Reserve’s dovish stance. This marked December as one of the best […]
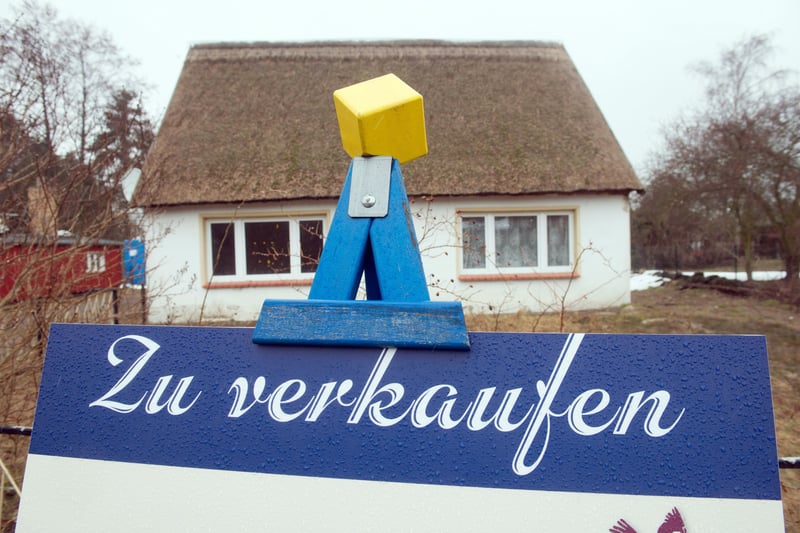
Dieses Urteil ist für Immobilienerben viel Geld wert
Wer eine Immobilie aus einer Erbengemeinschaft verkauft, musste bisher darauf Einkommensteuer zahlen. Dank einer neuen Entscheidung der obersten Finanzrichter ändert sich das nun.

The ballad of Lars and Bruno
Bruno Crastes was one of the most gifted fund managers of his generation. Why did he bet so much on the notorious Lars Windhorst?
Hintze preps for launch of new hedge fund firm following CQS sale
Lord Michael Hintze, who recently sold the majority of his credit-focused investment firm CQS to a unit of Manulife Financial Corporation (Manulife), has begun initial preparations for the launch of a new hedge fund firm, according to a report by Bloomberg.
Hedge funds up 2.14% in December, says S&C GlobeOp
Global hedge funds recorded an average gain of 2.14% in December according to the gross return of the SS&C GlobeOp Hedge Fund Performance Index for the month, while hedge fund flows as measured by the SS&C GlobeOp Capital Movement Index declined by 2.37% in January.

Reflecting on COP28: What happened and what comes next?
Logistically, COP28 was a massive undertaking, in all respects. Shifting the venue from Abu Dhabi to Dubai allowed the United Arab Emirates to host the conference at Expo City Dubai, taking advantage of the existing and expansive facilities covering over 1,000 acres and avoiding the cost of new construction and infrastructure to accommodate the large […]

Meilenstein beim Volumen: Passive überholen aktive Fonds in den USA
Der Wendepunkt ist erreicht: Erstmals verwalten an einem Index ausgerichtete US-Publikumsfonds mehr Geld als ihre aktiv gesteuerten Pendants. Damit scheint der passive Investmentstil seinen Siegeszug fortzusetzen. In Europa hingegen ist diese Wegmarke noch nicht in greifbarer Nähe.

Die Asset-AI von ETH-Spinoff Aisot revolutioniert Anlagestrategien
Künstliche Intelligenz hilft beim Anlegen – das klingt etwas zu harmlos. Denn Aisot Technologies stösst gerade eine Fintech-Revolution an.

Studie: Gold als Anlageklasse für institutionelle Anleger
Historisch gesehen hatte Gold nicht nur eine einzigartige Rolle in der Entwicklung von Nationen, sondern repräsentiert auch das Edelmetall, das in den letzten fünfzig Jahrhunderten als Geld verwendet wurde. Mit der Abschaffung des Goldstandards zu Beginn der 1970er Jahre endete seine formale Funktion als monetärer Vermögenswert und seine Eigenschaft als potentielle Investitionsmöglichkeit hat an Bedeutung […]

Bundesverband fordert Reform des Gemeinnützigkeitsrechts ein
Der Bundesverband Deutscher Stiftungen hat in einem auf seiner Webseite veröffentlichten Positionspapier Forderungen zur geplanten Reform des Gemeinnützigkeitsrecht vorgelegt. Der Verband macht darin 21 Vorschläge an die Bundesregierung. SPD, Grüne und FDP hatten sich 2021 in ihrem Koalitionsvertrag auf eine Modernisierung des Gemeinnützigkeitsrechts verständigt.

Davos Debate: Should Tokenization Follow the ‘Same Activity, Same Rules’ Approach?
Regulation should be technology-agnostic, and focus on the activity and the outcome. But with blockchain-based security issuance, that approach could hold back the industry’s progress, says Noelle Acheson.
Tokenization Of Financial Assets
What is tokenization and why is it important for the future of finance? Tokenization is the process of converting real-world assets, such as stocks, bonds, real estate, art, or commodities, into digital tokens that can be stored, transferred, and traded on a blockchain.
Partner


