Trends

Ranked: Countries With the Highest Debt-to-GDP Ratios

Ranked: Countries With the Highest Debt-to-GDP Ratios

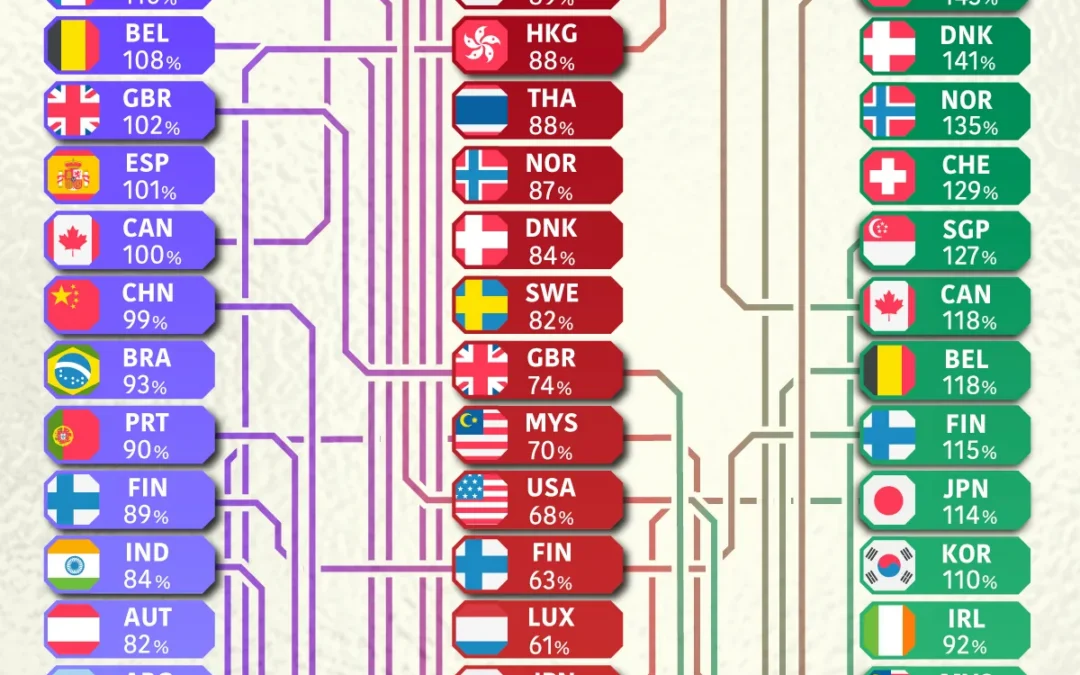
Luxembourg has the highest combined debt load in the dataset at 446.4% of GDP, followed by Hong Kong at 406.5% and Japan at 369.5%. Japan leads government debt at 194.5% of GDP, Switzerland leads household debt at 123.0%, and Luxembourg leads corporate debt at 358.8%. To a report by visualcapitalist. 08.09.2026

mehr lesen
Das sind die 10 größten Verwahrstellen Deutschlands

Das sind die 10 größten Verwahrstellen Deutschlands

Das verwahrte Vermögen verteilt sich wie folgt: Bei offenen Wertpapierfonds verwahrt Caceis 9,0 Milliarden Euro in Publikumsfonds und 18,1 Milliarden Euro in Spezialfonds. Im Bereich offener Sachwertefonds kommen 4,5 Milliarden Euro in Publikumsfonds und 48,1 Milliarden Euro in Spezialfonds hinzu. Nach einem Report von private-banking-magazin. 08.09.2026

mehr lesen
Ranked: The World’s Cities With the Most Tree Coverage

Ranked: The World’s Cities With the Most Tree Coverage

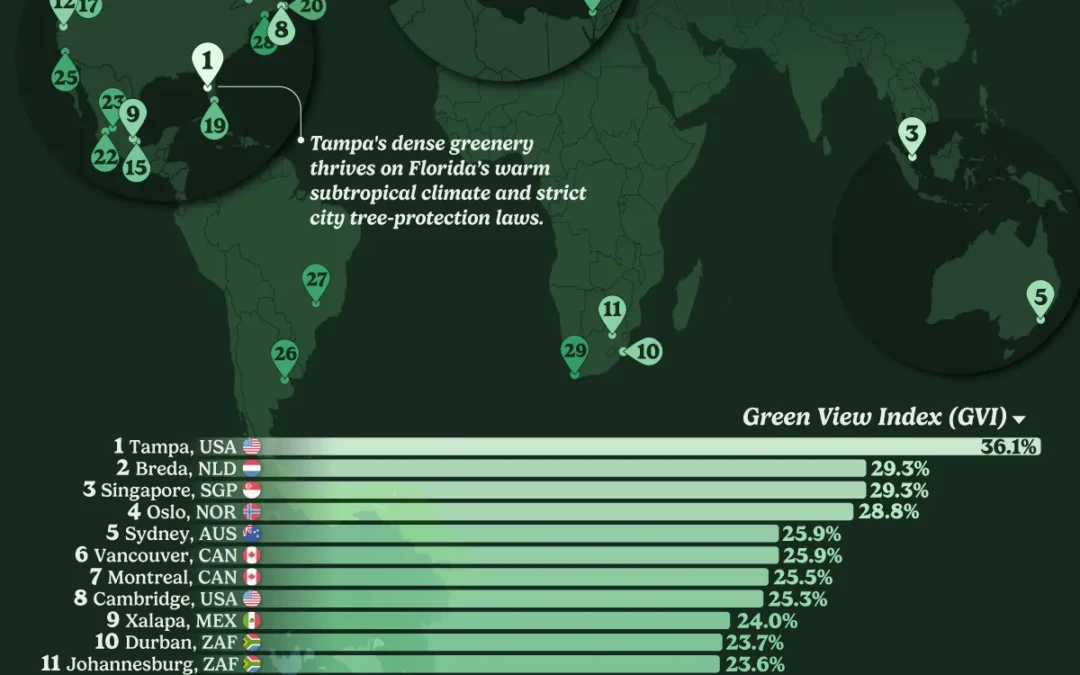
Tampa ranks first with a Green View Index (GVI) of 36.1%, 6.8 percentage points above Breda and Singapore. Eight cities have a GVI above 25%, including Oslo, Sydney, Vancouver, Montreal, and Cambridge. Treepedia measures greenery from a pedestrian’s perspective, capturing the share of tree canopy visible along city streets. To a report by visualcapitalist. 07.09.2026

mehr lesen
Der europäische Hotelinvestmentmarkt bleibt resilient – Interesse an großvolumigen Deals steigt

Der europäische Hotelinvestmentmarkt bleibt resilient – Interesse an großvolumigen Deals steigt

Europäisches Hotelinvestmentvolumen lag im H1 2026 bei 11,7 Mrd. Euro, minus 9,5 % gegenüber H1 2025Transaktionen im Wert von über 100 Mio. Euro stiegen im Jahresvergleich um 30 %Investitionen aus Asien-Pazifik gegenüber Vorjahr versechsfacht London blieb Europas aktivste Stadt, vor Paris, Wien und Madrid. Nach einem Report von Konii. 07.09.2026

mehr lesen
Ranked: Countries With the Most Lakes

Ranked: Countries With the Most Lakes

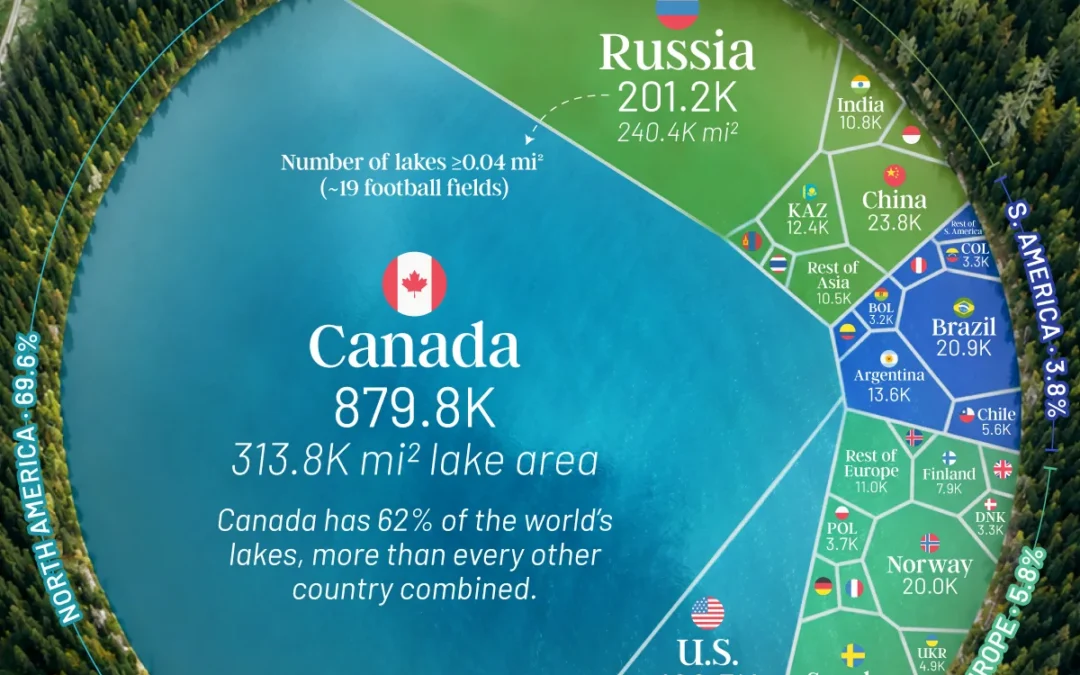
Canada has nearly 880,000 lakes, accounting for 62% of the 1.42 million lakes in this dataset. Canada alone has more lakes than the rest of the world combined, followed by Russia with 201,240 and the U.S. with 102,519. To a report by visualcapitalist. 05.09.2026

mehr lesen
Mapped: The Biggest Buyers of U.S. Oil

Mapped: The Biggest Buyers of U.S. Oil

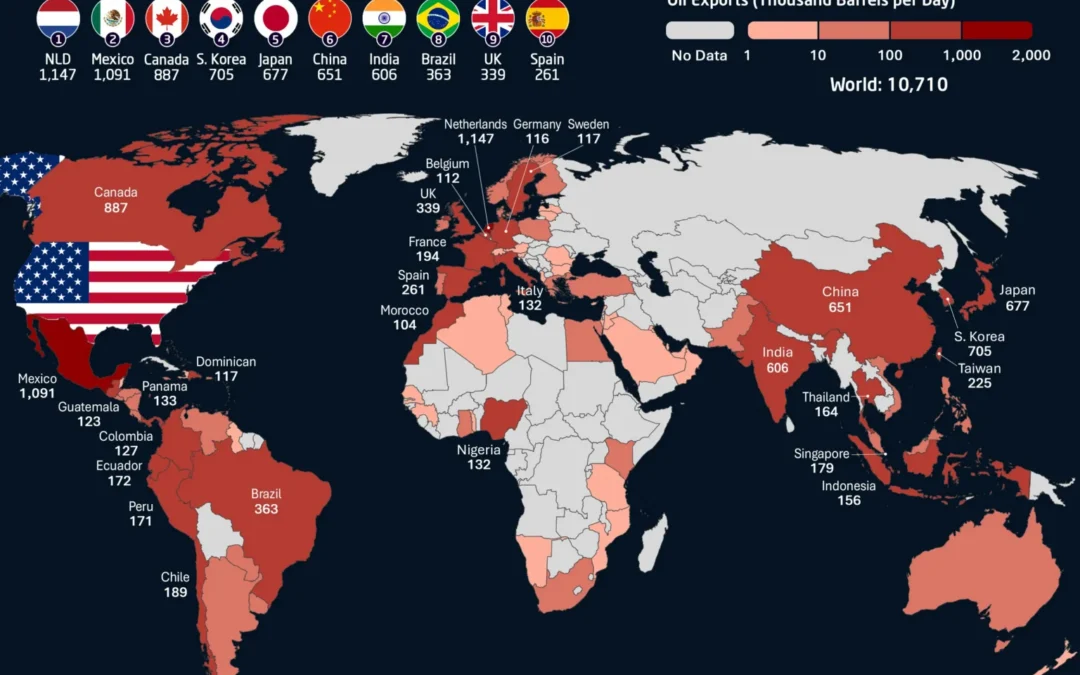
The U.S. exported 10.7 million barrels of oil per day in 2025, including crude oil and petroleum products. The Netherlands was the top destination at 1.15 million barrels per day, narrowly ahead of Mexico at 1.09 million. To a report by visualcapitalist. 04.09.2026

mehr lesen
Mapped: America’s Oil Imports by Country

Mapped: America’s Oil Imports by Country

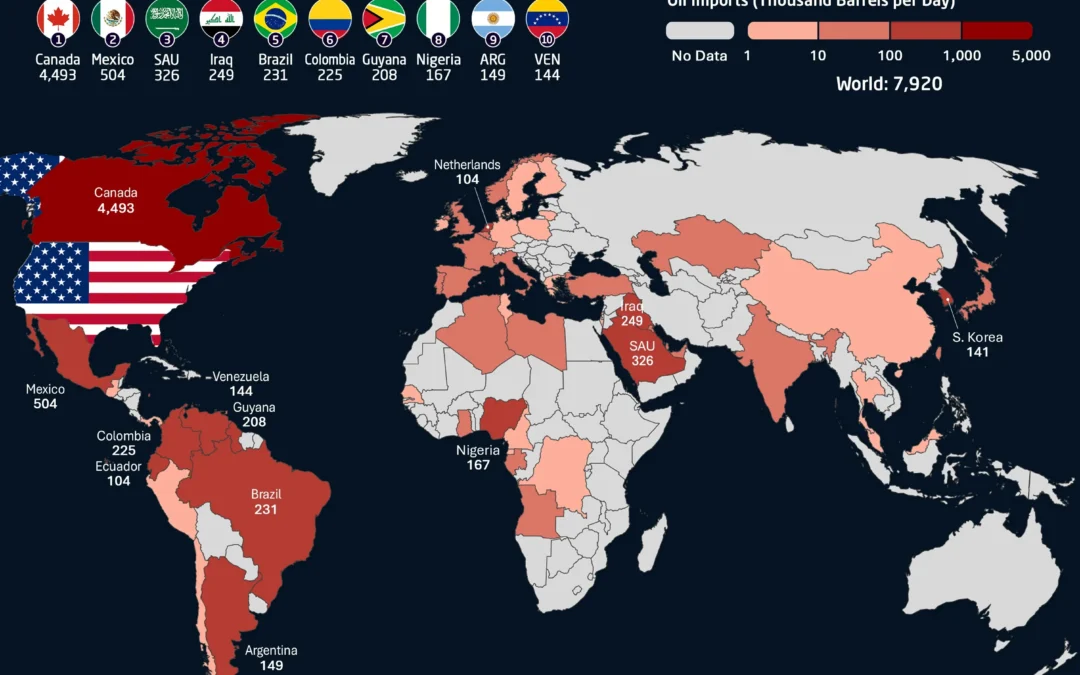
The U.S. imported 7.9 million barrels of oil per day in 2025, including crude oil and petroleum products. Canada supplied nearly 57% of those imports, far more than any other country. Mexico ranked second, followed by Saudi Arabia, Iraq, and Brazil. To a report by visualcapitalist. 03.09.2026

mehr lesen
Ranked: Housing Costs in Every U.S. State in 2026

Ranked: Housing Costs in Every U.S. State in 2026

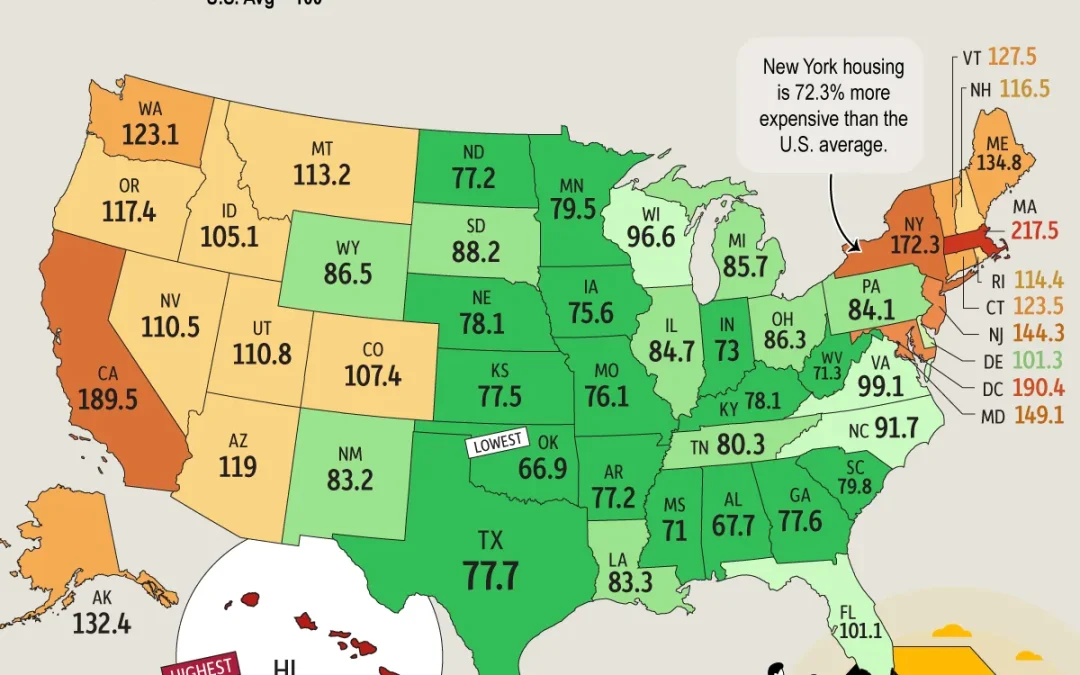
Hawaii has the highest housing cost index at 302.4, more than three times the national benchmark. Massachusetts ranks second at 217.5, followed by the District of Columbia and California. Texas stands out among large states, with housing costs 22.3% below the national average. To a report by visualcapitalist. 02.09.2026

mehr lesen
Ranked: The World’s Top Fuel Producers by Weight

Ranked: The World’s Top Fuel Producers by Weight

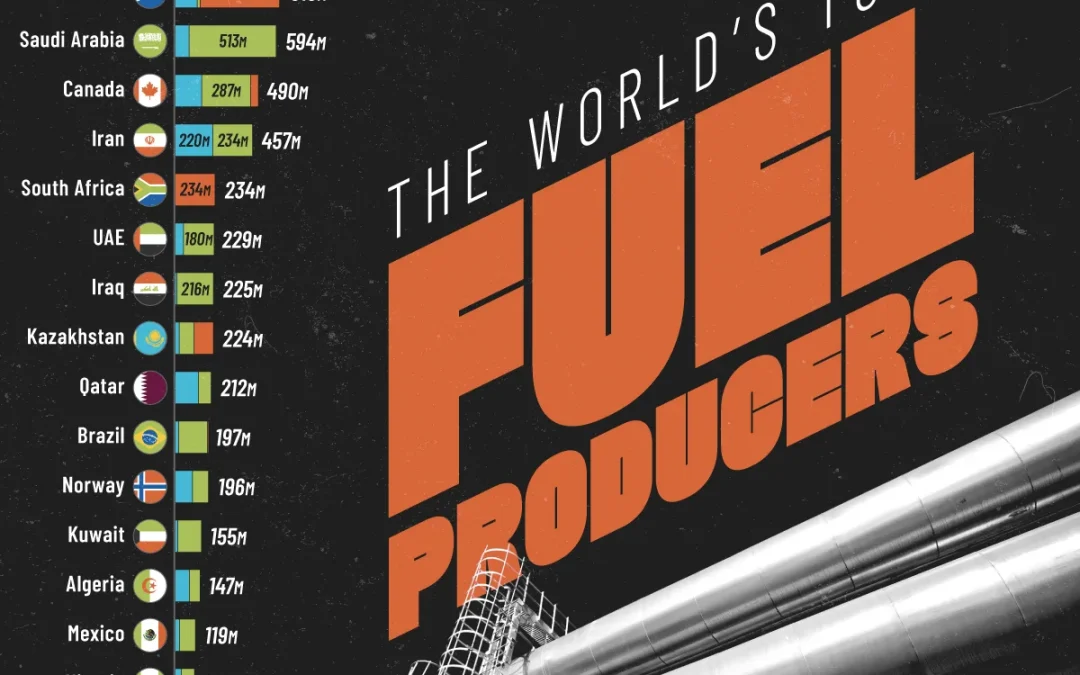
China ranks first in fuel production by weight, driven by 4.4 billion metric tons of coal output. The U.S. ranks second overall and is the world’s largest producer of both oil and natural gas. Coal-heavy countries rank prominently because this comparison measures physical output by weight rather than energy content. To a report by visualcapitalist. […]

mehr lesen

Partner

Logo Feri
J-Safra-Sarasin
Dr. Peters Group Logo

Analysen

Marktberichte

Community

Podcast